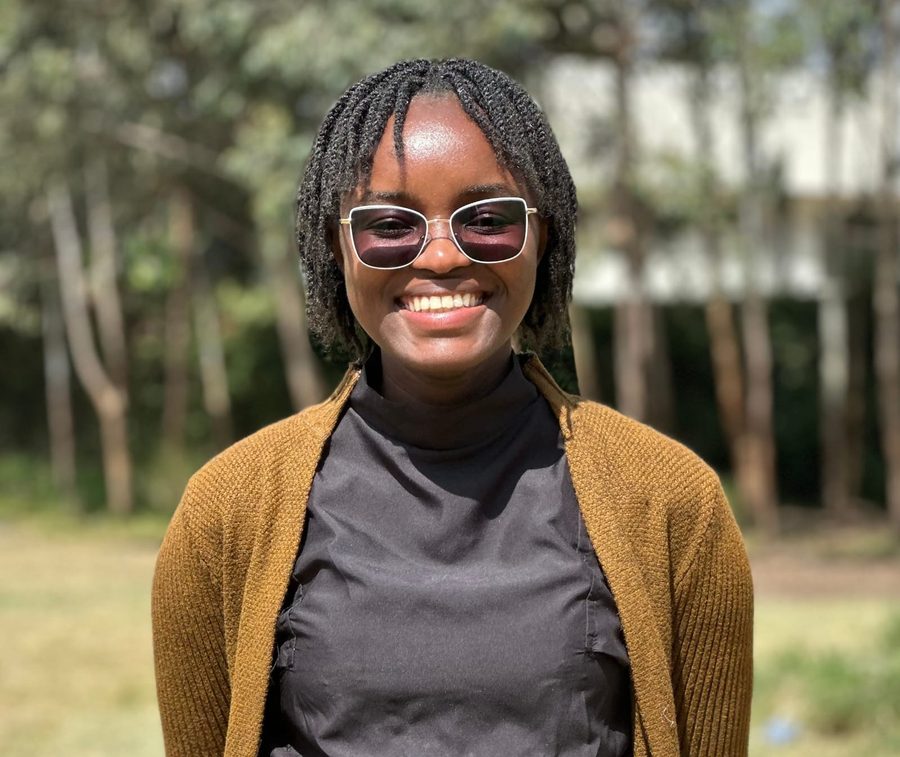
I'm a statistics graduate based in Nairobi, and I build the data systems behind good decisions, from KoboToolbox forms in the field to Power BI dashboards for reporting. For the past two years I've supported monitoring, evaluation and data quality for public health and community development programmes across Kenya.
From the first field form to the final dashboard, I support each stage of getting programme data right.
Validation, deduplication and completeness checks that catch errors before they reach a report.
Digital tool design in KoboToolbox and ODK, enumerator support and multi-county field coordination.
Analysis in SPSS, Stata, R and SQL to turn raw datasets into findings that hold up to scrutiny.
Power BI dashboards and Advanced Excel workbooks that make programme data easy to act on.
Roles spanning data entry, field research, quality remediation and MEL support across Kenyan public health and development programmes.
Entered and verified programme data, corrected discrepancies and built Excel trackers to monitor data entry progress and support timely reporting.
Cleaned and verified programme data across 8 counties, followed up with field teams on missing information, and prepared summaries and Power BI dashboards.
Set up validation checks, built Excel trackers for reporting deadlines, and flagged and followed up on errors and missing information.
Developed 8+ digital data-collection tools in KoboToolbox and built monitoring trackers consolidating records from multiple counties.
Collected and entered field data using structured survey forms and helped prepare research reports from the results.
Supported data collection and entry, interviewed respondents, and compiled findings into structured reports.
Collected and verified field data for M&E activities in rural communities, engaging directly with community members.
Two personal projects, chosen to show both ends of the pipeline: cleaning messy raw data, and turning clean data into a dashboard people can actually use.
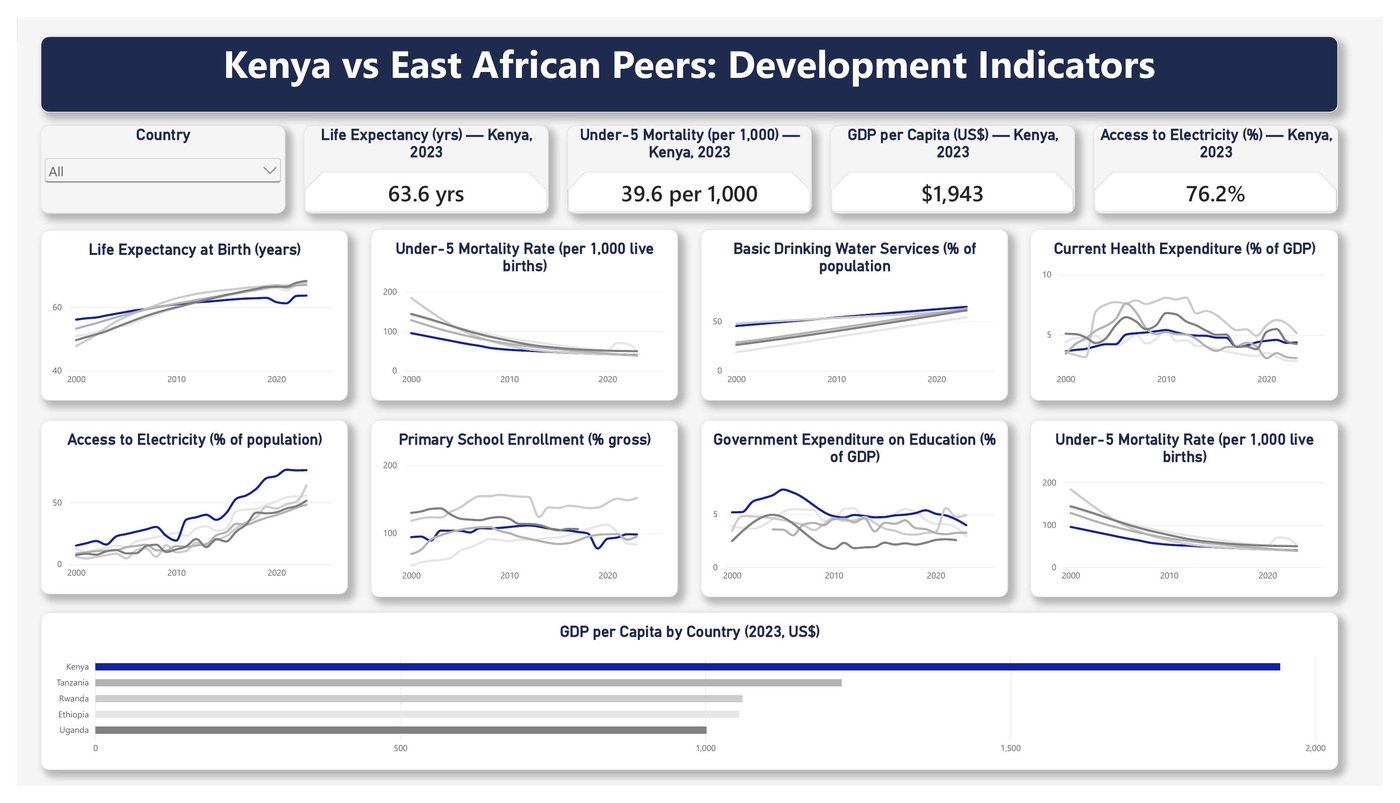
A Power BI dashboard comparing Kenya against Tanzania, Uganda, Rwanda and Ethiopia across eight indicators in health, economy and education, pulled live from the World Bank API. One parameterised Power Query function fetches all eight indicators rather than a separate query for each, so the dashboard is built to refresh as new figures are published.
Kenya is highlighted in navy against muted grey peers, with headline cards for life expectancy, under-5 mortality, GDP per capita and electricity access, all driven by DAX measures.
My BSc Statistics capstone project at the University of Nairobi, built with a team of four coursemates under Prof. George Muhua. Using a Bondora peer-to-peer lending dataset of 18,204 loan records and 36 variables, we built a binary logistic regression model in R to predict the probability of loan default from demographic, socio-economic and loan-specific factors.
The workflow covered bivariate and correlation analysis, backward stepwise variable selection, and model evaluation with Wald's test, a likelihood ratio test and a confusion matrix. The final model reached 65% accuracy, with age, gender, employment status, occupation, home ownership and loan terms all coming out as significant predictors of default.
A 199-record, 28-column public health incident dataset from Insecurity Insight, hosted on HDX, with inconsistent country naming, missing fields and overlapping disease tags. I standardised country names with an ISO-code lookup, removed empty columns, and restructured six disease fields into binary flags to preserve multi-disease incidents rather than collapsing them into one category.
Every cleaning assumption is documented, such as treating blank counts as zero, and the results are validated through summary breakdowns by country, year and disease type.
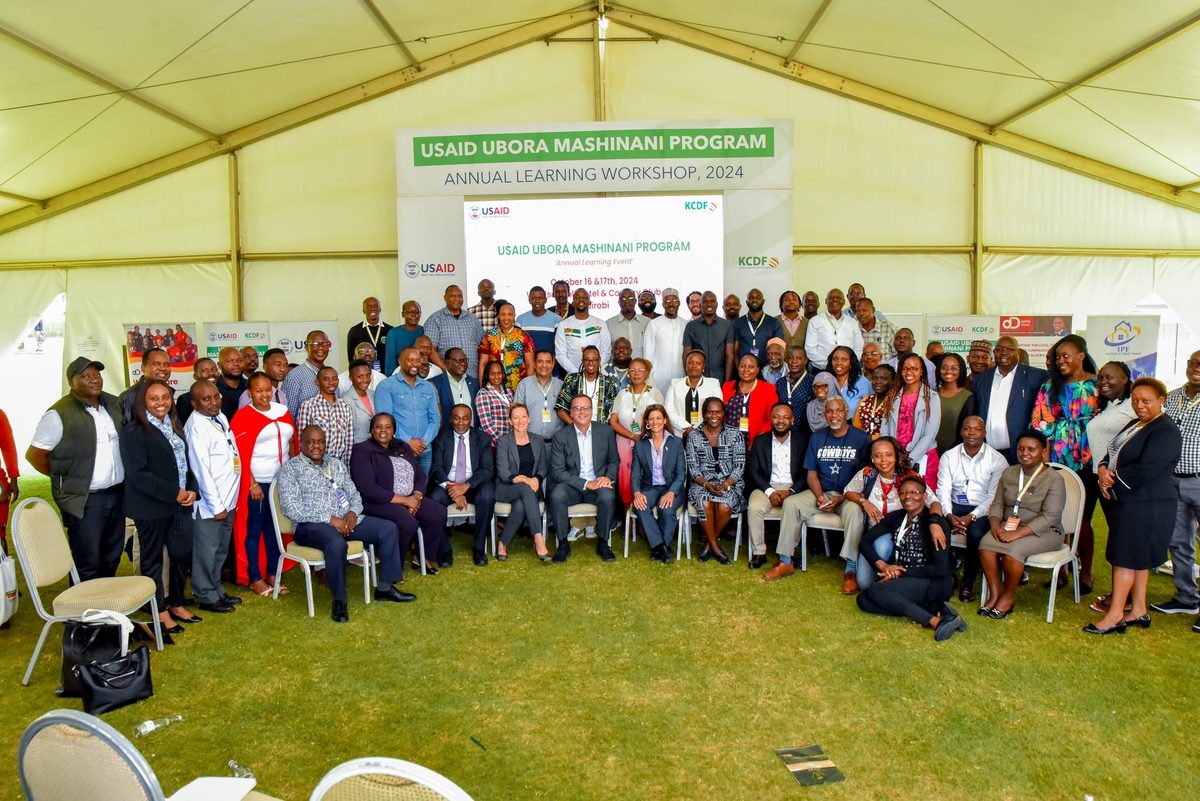
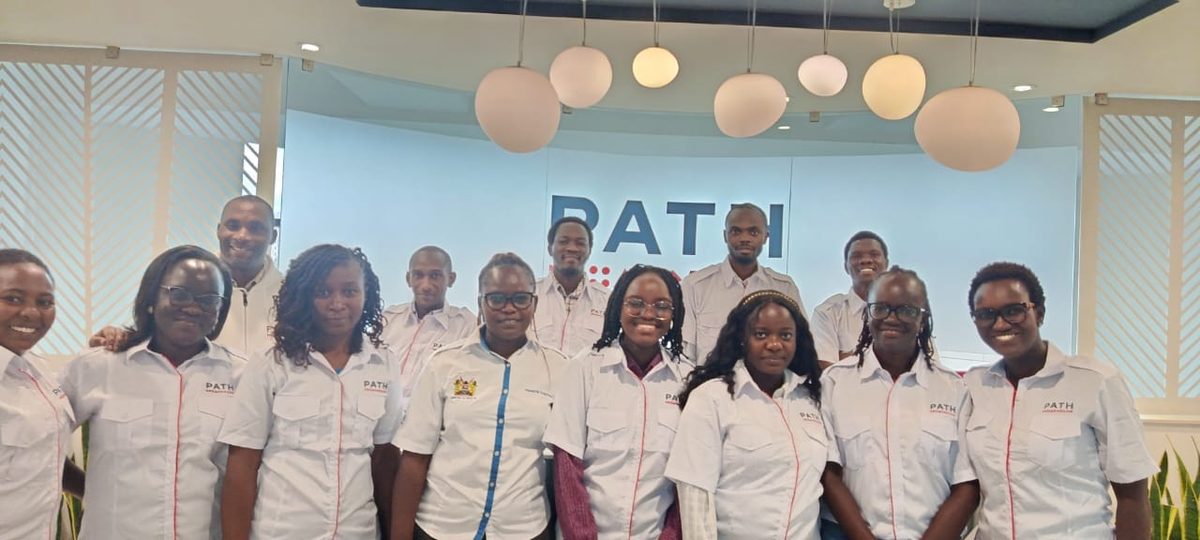
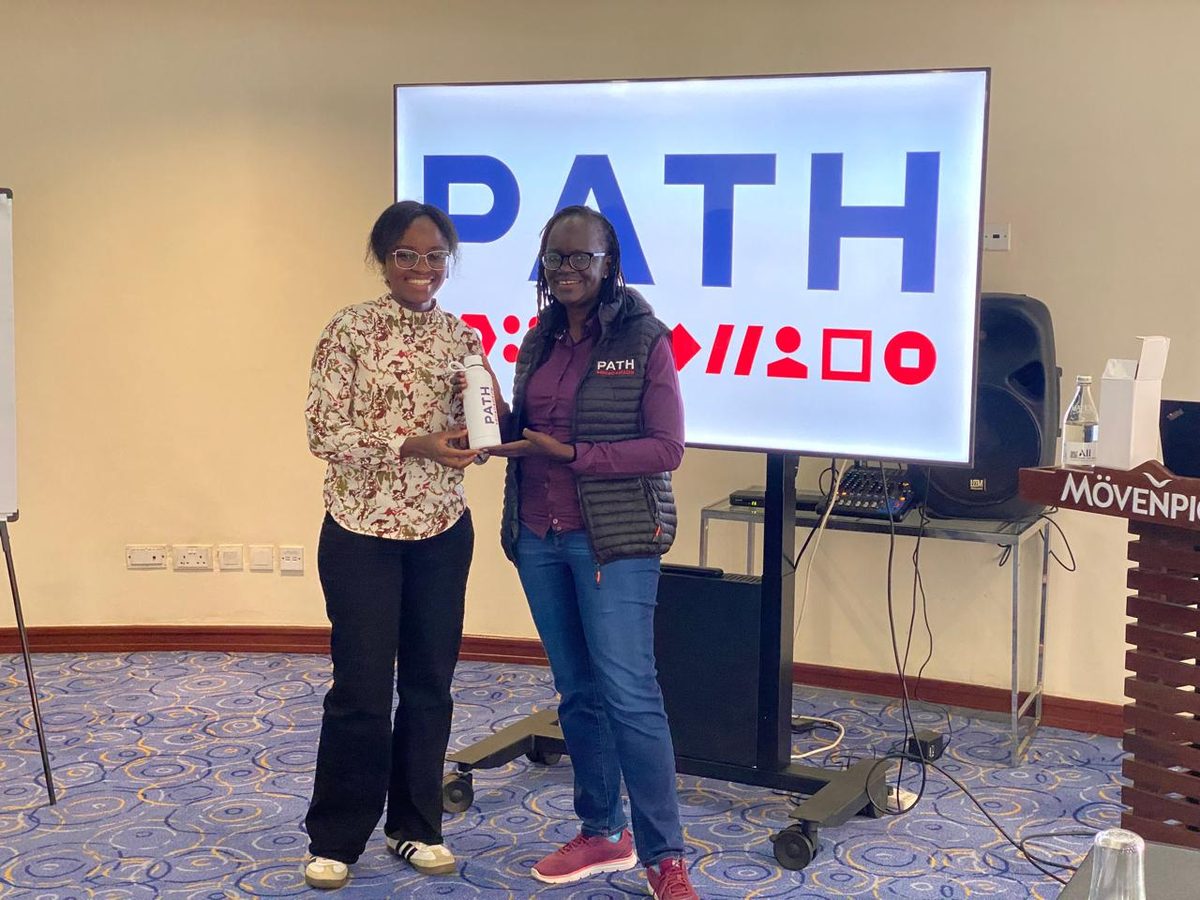
Moments from programme work and team learning events over the past two years.
USAID Ubora Mashinani Program — Annual Learning Workshop, 2024
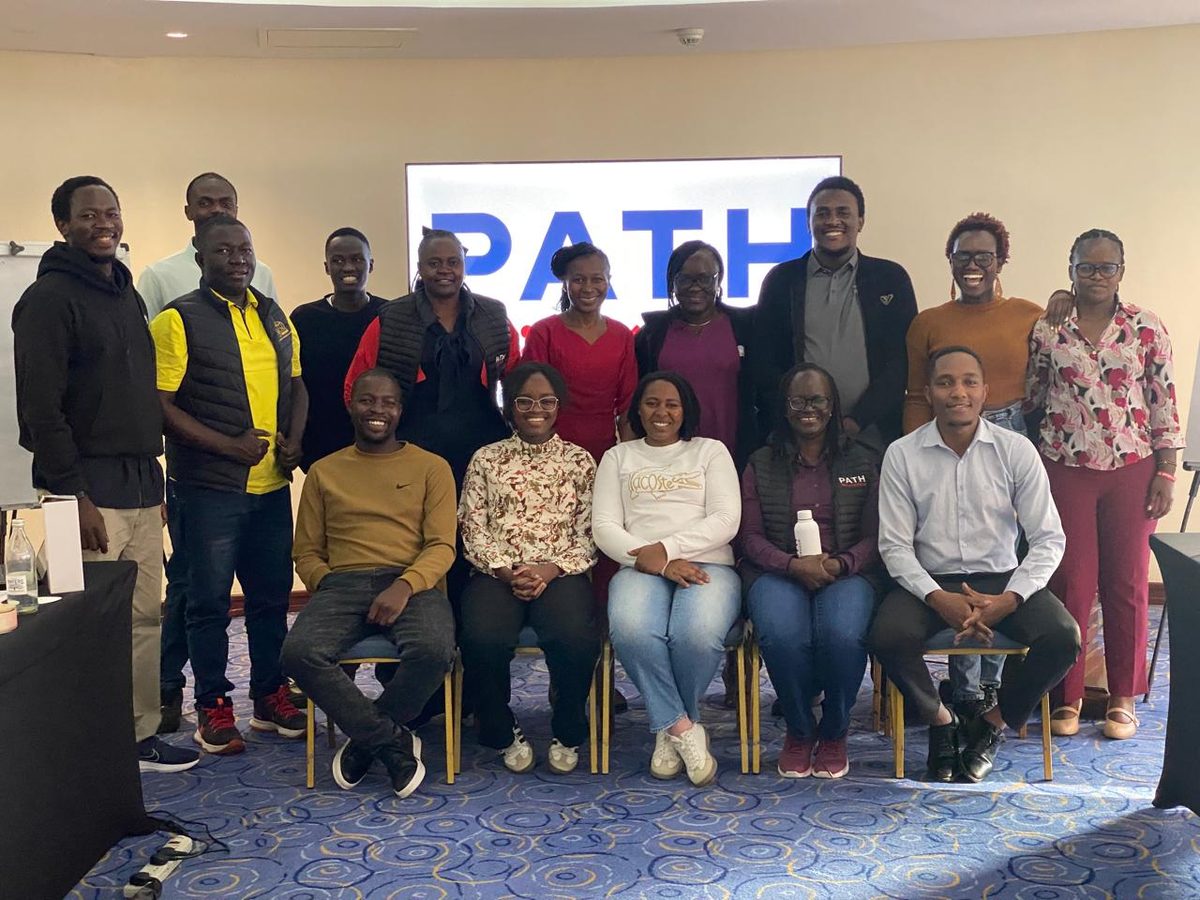
PATH Kenya data team, Nairobi
Team session, PATH Kenya
PATH Kenya team training
Graduation, University of Nairobi
Ongoing coursework in data analysis, monitoring and evaluation, and applied AI tools.
Whether it's cleaning a dataset, running a field data collection exercise, or building a dashboard, I'd like to hear about it.